Is the long run of US oil and gas growth almost over?
Every month the US EIA (Energy Information Administration) publishes production estimates for shale gas and LTO (light tight oil AKA shale oil). Despite industry and media hype that US oil prodcution will soon reach 15 million barrels per day, some contrarian analysts, including this one, think that US LTO is close to or possibly even past peak and shale gas is not far behind. LTO is arguably the most important oil production in the world at the moment because it both powers the American economy and has been, by far, the largest source of global oil production growth in the last decade. Thus, keeping a watch on these monthly numbers is quite important.
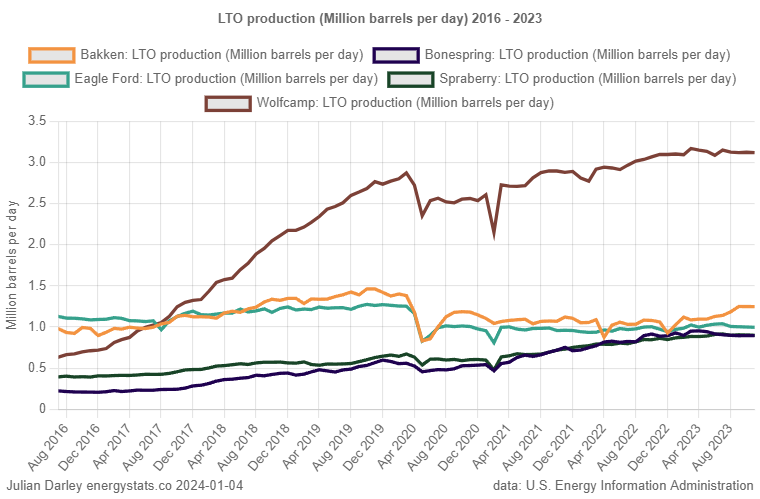
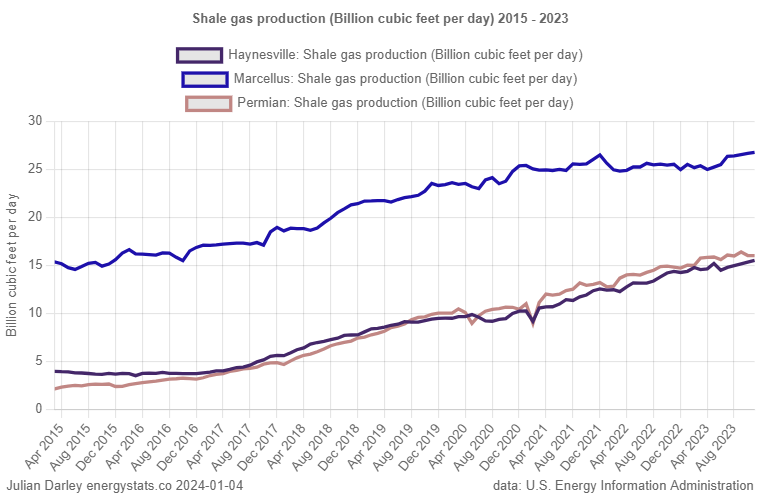
The three plays shown here are the most important and the only ones still growing, but now, Permian is flat and while there is a tiny bit of lift in Marcellus, the largest gas play in the US, and a little bit more in Haynesville, everything else is like LTO – either in plateau or declining or now so shrunk they don’t matter. Flat Permian reflects the state of LTO in Wolf Camp, Bonespring, and Spraberry seen above, since the EIA lumps the gas that comes from the Permian basin into one category rather than breaking it out into separate plays as for oil (those plays being Wolf Camp, Bonespring, and Spraberry)
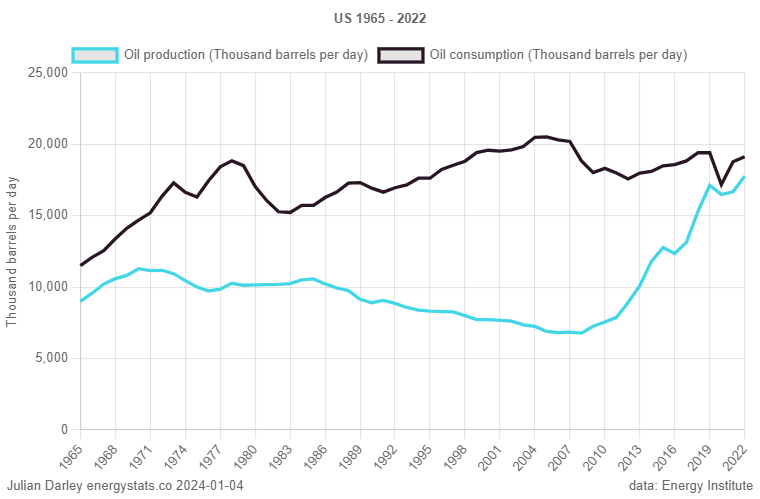
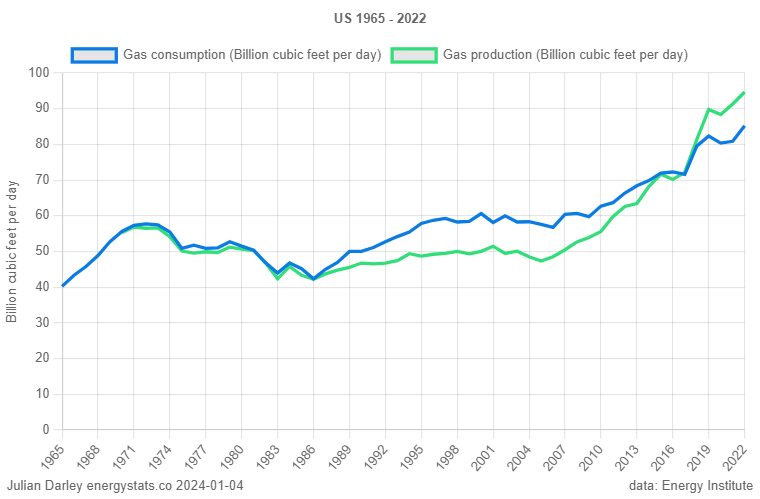
With energy, as with any other critical resource, it is vital to add things up and keep the larger picture in mind, so as a reminder of how fast the US is consuming all this non-renewable energy – it is after all ancient sunlight, a form of capital deposited a long time ago which we are burning through globally at an astonishing rate – here are two ‘energy balance’ charts showing US production and consumption (data are only available up to 2022).